
In 1806, a twenty-two-year-old man with no fortune loaded a brigantine in Boston with 130 tons of a product that nobody in the Caribbean had ever bought: cut ice from a frozen lake. The Boston Gazette reported it with the incredulity it deserved: "No joke. A ship has dispatched at the customs office to Martinique with a cargo of ice" Wikipedia, Frederic Tudor. Frederic Tudor lost $4,500 on that first trip and continued to lose money on subsequent shipments to Havana. It didn't matter: in less than a century, the industry he invented from scratch came to employ "90,000 people and 25,000 horses," capitalized at around $28 million in late 19th-century dollars Wikipedia, Ice trade. Cutting, insulating, and transporting natural ice became, for almost a hundred years, a lifetime career for tens of thousands of people in the Northern Hemisphere.
And then, in a surprisingly short period, it ceased to exist. It wasn't competition that killed it. A technology — mechanical refrigeration — killed it, making the entire trade unnecessary: cutting blocks from a frozen lake, insulating them in sawdust, transporting them by ship before they melted. I return to that story at the end of this piece because it's the cleanest parallel I know of total technological disruption over an entire industry. But the topic today isn't ice. It's a much more uncomfortable question for anyone with a child, a career, or both: what is generative AI — not the kind that takes our jobs, but the kind that's already reconfiguring what can be studied — doing to the university's academic offerings worldwide?
The clarification matters because almost everything discussed about AI and universities is measured with the wrong yardstick: job projections, sentiment surveys, headlines about "this career is going to disappear." I wanted to measure something else, much more verifiable: programs that open, programs that close, actual enrollment by field of study, in multi-year series — never a single twelve-month spike — in the US, Mexico, China, India, Germany, and the European Union, with the added context of the OECD, G7, G20, and BRICS, and what is known (and not known) about Latin America. I spent several weeks cross-referencing primary sources from governments, statistics offices, professional associations, and academic reports. This is what I found, and it's not always what's said on social media.
The trend is reversing: the first drop in twenty years
I'm starting with the most counterintuitive case of all, because for fifteen years, it was exactly the opposite of what's being reported today. The number of undergraduate students in computer science in the US more than doubled in a decade, from around 56,000 students in 2013-14 to 122,000 in 2022-23, and had been growing steadily for sixteen consecutive years until 2024, with a +6.8% increase alone in the 2023-2024 cycle National Student Clearinghouse CRA Taulbee Survey. Everything pointed to the fact that generative AI — trained, written, and deployed mostly by programmers — would further boost this trend.
That's not what happened. The 2025 survey by the Computing Research Association, comparing the same academic units in both years, showed an abrupt reversal: undergraduate degrees -3.1%, master's degrees -24.9%, doctoral degrees -2.2% CRA, 2026. The National Student Clearinghouse, with data from the entire four-year university system, independently confirmed the pattern: enrollment in computer science and information sciences -8.1% in fall 2025 (to around 606,000 students), with "computer science" specifically down -11.2% and graduate programs down -14.0% — the first drop in CS enrollment in nearly twenty years National Student Clearinghouse. And it wasn't just a one-semester stumble: the decline continued in spring 2026, with another -8.4% year-over-year and an additional -14% in graduate programs, according to the same report updated by Fortune in August 2026 Fortune, agosto 2026. This is now three consecutive admission cycles, measured by at least three independent sources that don't cite each other as a primary source — that's what sets this apart from a one-year blip.
An analysis by Goldman Sachs, by economist Pierfrancesco Mei, cross-referenced census data from 2022 to 2024 for over 180 majors and found that computer science and programming each fell by more than 10% in the 2025-26 cycle — the first statistically significant evidence that students are actively avoiding careers with high exposure to AI. In the same analysis, health and engineering fields grew by around 3% on average Fortune sobre Goldman Sachs, junio 2026. And this is already visible in specific institutions, not just national aggregates: the University of California dropped to 12,652 undergraduate students in CS in 2025 after falling 6% (2024→2025) and 3% (2023→2024), a 9% cumulative decline over two years; Princeton dropped from 150 students in the class of 2026 to 117 in the class of 2027 and 74 in the class of 2028; Arizona State fell by around 14% between 2024 and 2025 TechUnpacked. CUNY reported a -15% decline in the same period, and a survey of computer science programs found that 62% of them reported enrollment declines Futurism. (A data point from the same source about Washington University in St. Louis, -16% over two years, couldn't be corroborated with a second independent source, so I'm leaving it out of the hard evidence.)

One additional data point, with a single source and no verified cross-corroboration — I'm marking it as yellow, not green: the number of high school students who took the AP Computer Science A exam peaked at 98,136 in 2024 and fell by around 17% by 2026, while overall participation in AP exams grew ~7% and subjects like Biology, Chemistry, and Physics 1 grew by double digits TechUnpacked / College Board. If confirmed with more solid data from the College Board, this would be the earliest signal of all: the exodus would start before college, in high school.
Now, I owe it to skeptical readers to address the part that most headlines covering this story left out: a study by Jacob Light from Stanford, analyzing the same data on the decline of CS in 2025-26, found that the evidence "does not show that artificial intelligence caused the decline" in isolation — there's a convergence of factors, not a single proven cause Futurism sobre el estudio de Jacob Light. I suspect there are at least three trends at play: the real fear that AI will automate junior-level coding jobs, a correction after a decade of "everyone should study CS" that filled classrooms with people lacking a genuine calling, and a normal cycle of saturation in the entry-level job market that was already being felt before ChatGPT existed. What I can confirm with evidence is the decline itself — confirmed, sustained over three cycles, and for the first time in twenty years. The exact cause is still up for legitimate debate.
And there's an irony within the irony: while generic "computer science" is declining, the number of US institutions with a formal degree dedicated to artificial intelligence grew from 4 in 2020 to 23 in 2025; AI master's programs increased "by over 200%"; and PhDs with a specialization in AI/ML rose from ~9% of all PhDs awarded in 2015 to ~25% in 2024 CRA / Center for Evaluating the Research Pipeline. It's not that students are afraid of computing in the abstract. They want the specific label "AI" on their degree, not the generic "CS" that no longer distinguishes anyone in the market.

The collapse of Computer Science in the US, measured four times
Four sources that don't cite each other - CRA Taulbee, the National Student Clearinghouse (twice), and a Goldman Sachs analysis - all agree on the same reversal: US computer science enrollment went from growing +6.8% in the 2023-24 cycle to sharply declining in bachelor's, master's, and doctoral programs.
Ver los datos
| Concepto | 2023-24 | 2025 |
|---|---|---|
| CRA Taulbee - Bachelor's (same study, two cycles) | +6.8% | -3.1% |
| CRA Taulbee 2025 - Master's | -24.9% | |
| CRA Taulbee 2025 - Doctoral | -2.2% | |
| Clearinghouse - Fall 2025 (CS-specific) | -11.2% | |
| Clearinghouse - Spring 2026 (year-over-year) | -8% | |
| Goldman Sachs (2022-2024, CS and programming) | > -10% |
The rumor about "universities closing Law schools": yes, no, and it depends on which Law school
This is the specific rumor I was asked to verify, and the correct answer is "partially, with a distinction that almost no one makes". The total enrollment of JD students in ABA-accredited law schools dropped by just 1.2% in fall 2024 (to 115,410 students) — but rebounded to 120,039 in fall 2025, a +4% increase, with the first-year class rising 7.9% and non-JD programs growing 6.3% ABA Journal / TaxProf Blog. That's the opposite of a collapse: it's a one-year rebound after a one-year decline, and I'm not presenting it as a sustained trend in either direction just yet.
Where there is a sustained and verifiable contraction — spanning over a decade, not just a cycle — is in the non-ABA accredited segment: California's state and non-accredited law schools decreased from 40 in 2012 to 28 in fall 2023, mostly due to voluntary closures ABA Journal. And at the same time — which makes the "Law is dying" headline so inaccurate — Purdue Global Law School received approval in January 2025 to add a full-time JD program to its existing part-time offering ABA Journal. What's shrinking is a specific niche — small, non-accredited, low-prestige state schools — while the large accredited segment is breathing, and even expanding in some areas.
What did change, and measurably so, is the curriculum, not the enrollment. A 2024 survey by the ABA Task Force on Law and Artificial Intelligence of 29 faculties found that 55% already offered specific AI courses, 62% integrated AI into first-year classes, and 85% of respondents contemplated curriculum changes ABA Task Force on Law and AI. The follow-up report from the same task force, published in December 2025, concluded that AI "has gone from being an experiment to being infrastructure" for the legal profession ABA AI Task Force, Year 2 Report. Law schools aren't closing down. They're rewriting what they teach within Law, while enrollment remains remarkably stable. I'll save the in-depth analysis of what this means for the junior lawyer job market for a dedicated piece — here, I'm only measuring academic supply, and on that, the verdict is clear: the rumor of mass closures doesn't hold up to hard data.
Graphic design: panic arrived before the decline
The other specific case I was asked to review is graphic design, and here the finding is almost a mirror image of the one for Law: there's real alarm from the industry side, but it hasn't shown up in the degrees awarded yet. Data USA, the aggregator built on the raw data from NCES/IPEDS, reports 10,676 graphic design degrees awarded in 2024 in the United States, with the number growing 16.3% from the previous year Data USA. I'm highlighting this in yellow because it's still just one aggregator, and I haven't cross-checked the raw IPEDS table directly, but up to 2024, there's no sign that the concern about AI is reflected in fewer degrees awarded nationally.
All that anxiety does have a counterpart on the employment side, and it's the only line in this text I'll dedicate to the job market instead of academic offerings: the World Economic Forum's Future of Jobs Report 2025 — based on interviews with 1,000 employers representing over 14 million workers in 55 countries — ranks graphic designers as the 11th fastest-declining profession globally by 2030, a drastic shift from the previous report World Economic Forum, vía Design Week. But, as we just saw, that employment alarm still hasn't translated into fewer enrollments or degrees awarded. Minnie Moll, CEO of the UK's Design Council, responded to these reports by acknowledging both challenges and opportunities, and betting on retraining a million people in sustainable design skills by 2030, rather than declaring the discipline dead Design Week.
What did actually close down in the world of design and arts weren't programs within large universities, but entire specialized institutions: the Art Institutes closed completely, the Pennsylvania Academy of the Fine Arts will stop awarding degrees after the 2024-25 cycle, and the Delaware College of Art and Design closed, explicitly citing declining enrollment, changes in FAFSA rules, and rising costs Delaware Public Media. It's an important distinction: it's not "graphic design as a discipline" that's dying within large universities, but a business model — the small, specialized college, almost entirely dependent on undergraduate enrollment in art and design — that can't survive the combination of fewer students and rising costs, with or without AI. A German study by Kunstfonds on generative AI and visual arts found that 45% of surveyed artists fear the devaluation of art by AI, and 55% fear increased competitive pressure Kunstfonds — the fear is real and measured, but it still lives in perception surveys, not in fewer people enrolling.
What is actually dying, with hard data: humanities, languages, and journalism
If the goal is to find a sustained, multi-year decline, measured in degrees awarded — not in fear, not in anecdote — the most compelling case in the entire United States isn't computer science or design. It's humanities. In 2024, the United States awarded 165,489 humanities degrees: the lowest number since 1991, and 30% below the 2012 peak (~236,000) AAAS Humanities Indicators. That discipline went from representing 13.1% of all the country's degrees in 2012 to just 8.4-8.5% in 2024. By discipline, the declines between 2012 and 2024 are brutal and consistent: languages other than English -48%, English -43%, history -41%, religious studies -59%, area studies -55%, classical studies -43%, comparative literature -32% AAAS Humanities Indicators. This started long before massive generative AI — the peak was 2012 — but the decline didn't stop after 2022; on the contrary, it accelerated: -13% just between 2021 and 2023, and the 69,254 "traditional" humanities degrees awarded in 2024 are the lowest since 1987.
Enrollment in languages other than English dropped 16.6% between 2016 and 2021 — almost 236,000 fewer students —, a cumulative decline of 29.3% since the 2009 peak. Of the fifteen most taught languages in the United States, only three saw growth: American Sign Language (+0.8%), Biblical Hebrew (+9.1%), and Korean (+38.3%, likely driven by K-pop and K-drama, not academic strategy) Inside Higher Ed sobre el censo MLA Modern Language Association, censo otoño 2021. A notable case that illustrates what this means on the ground: West Virginia University eliminated 32 of its 338 majors (12 undergraduate, 20 graduate) and 7% of its faculty in 2023, including the entire world languages department — French, Spanish, Chinese, German, Russian, linguistics, and TESOL — although it later said it would preserve instruction, not full majors, in Chinese and Spanish Inside Higher Ed.
Journalism has its own notable case and long series: at the University of Nebraska-Lincoln, journalism enrollment dropped from a high of 281 students in 2013 to a low of 171 in 2022, a decline of 20.8% from the 1998 level UNL, tendencias del programa. It's worth noting a nuance within the humanities crisis itself: visual and performing arts degrees didn't collapse in the same way — they fell from a peak of 97,799 in 2012-13 to a low of 88,507 in 2017-18, but partially recovered to 90,022 by 2020-21, just a -3.2% decline in that more recent period NCES, tabla 325.95. In other words, the performing and visual arts didn't follow the same downward trajectory as languages, history, and religious studies. I also clarify that the AAUP's own tracker of humanities program closures — built from media coverage — explicitly warns that it's not exhaustive and only reflects the cases that the press covered AAUP, Program Closures tracker: there are likely more humanities program closures than any public list captures.
What's growing quietly: health, trades, cybersecurity, and the "AI" label
While generic computing and humanities grab the headlines — one for falling unexpectedly, the other for falling over the past decade — there's a third group of fields that are growing sustainably, year after year, with almost no press coverage. Nursing is the clearest example: enrollment in entry-level BSN programs grew 7.6% in the 2024-2025 cycle (+19,830 students, to 283,303), the third consecutive year of growth; master's programs rose 6.8%; and the Doctor of Nursing Practice (DNP) has seen twenty-two years of continuous expansion since just 70 students in 2003 American Association of Colleges of Nursing.
Technical trade education, which has the least glamour on social media, is also growing sustainably: enrollment in public two-year colleges focused on trades rose around 20% from spring 2020 to 871,000 students in spring 2025; certificate programs rose 28.3% from fall 2021 to 752,000 students; and fields like "engineering technologies" (+8.3%), "mechanics and repair" (+10.4%), and "health professions" (+10.1%) continue to grow National Student Clearinghouse Research Center. Cybersecurity has its own long and sustained series: the total number of degrees and certificates in information security, auditing, and assurance grew 271% from 2012 to 2022, with around 25,000 titles in the specific cybersecurity program and 259,000 in the broader set of 26 related categories for 2022 NCSES/NSF.
There's even a field that breaks the stereotype of "all non-STEM fields are in crisis": political science. The American Political Science Association's annual survey found that in the 2023-24 cycle, more than 5% of departments reported a significant increase in enrollment, and another 5% reported a moderate increase, compared to just 1.5% and 22% respectively in the previous cycle APSA, Political Science Now. I'm highlighting this in yellow because the exact percentages have nuances that weaken the simple narrative of "sustained growth" - it's just one survey with a comparison of only two cycles - but it still contradicts the idea that any social science field is automatically in decline. Within the arts themselves, there's a similar nuance: enrollment of new undergraduate art students grew 2% in 2022-23, while new graduate art student enrollment fell 9% in the same period NASAD, encuesta HEADS - the entry level is holding up better than the graduate level, a pattern that, as we'll see, repeats in Germany.

The fields that are quietly growing in the US
While computer science is experiencing its first enrollment decline in nearly 20 years, four fields are sustainably growing in the US: nursing, two-year technical trades, cybersecurity, and formal AI degrees.
Nursing: +7.6%
BSN entry enrollment, 2024-2025 (AACN)
Technical trades: +20%
Public two-year universities, since spring 2020 (NSC)
Cybersecurity: +271%
Degrees and certificates awarded, 2012-2022 (NCSES/NSF)
AI degrees: from 4 to 23
Institutions in the US with dedicated AI degrees, 2020-2025 (CRA/CERP)
Germany and the European Union: the best data set on the planet
If the US has the most dramatic case, Germany has, by far, the best data. The federal statistics office (Destatis) publishes annual series by exact field, going back several decades, something no other country in this investigation offers with the same level of detail. And what those data show contradicts the narrative of "AI is scaring everyone away from computing" head-on: computer science enrollment in Germany grew steadily over three consecutive winter semesters - 260,078 (2023/24), 267,249 (2024/25), and 273,941 (2025/26) - a cumulative increase of 5.3% in three years, with female participation rising by nearly 12% Statistisches Bundesamt (Destatis). It's the largest individual discipline within the entire German MINT block (mathematics, computer science, natural sciences, technology), and it's moving in exactly the opposite direction of the US.
That doesn't mean everything in Germany is growing. Mathematics and natural sciences fell from 301,197 (2023/24) to 297,937 (2024/25) and 293,379 (2025/26), a decline of 2.6% in two years, while engineering remained almost stable, from 748,705 to 752,687 Destatis. New enrollments in the first semester decreased in almost all engineering fields in 2025/26: computer science -2.3% (46,100 new students), mechanical engineering -3.3% (23,000), electrical engineering -0.3% (14,100), civil engineering -0.6% (10,600) Destatis - a generalized slowdown in new enrollments, although total computer science enrollment continues to rise due to the accumulation of previous generations.
The sustained decline, the one that's been going on for over a decade, is in German humanities (Geisteswissenschaften): first-semester students in humanities fell 22% in twenty years - from 63,500 in 2003 to 49,500 in 2023, with their share of the total decreasing from 17% to just around 10% - while the total number of new students in all disciplines grew 28% in the same period Destatis. It's almost the same pattern, field by field, that I documented for the US, with one key difference: in Germany, it started and was sustained long before generative AI existed, so attributing the decline to ChatGPT would be simply false.

What about law? Here, Germany provides the most useful contrast to the US case. Students of Rechtswissenschaft (legal science) almost doubled between 1975 (51,566) and 2000 (102,889), continued to grow until a peak of 119,285 in 2020, and have since fallen to 116,760 in 2025 - a decline of just 2%, with over half a century of previous growth behind it Destatis, serie 1975-2025. A glance at just one year, 2023, nuances any hasty reading: new students in the law/economics/social sciences block were 191,000 that year (+0.3%); engineering 128,400 (+2.3%); mathematics/natural sciences 51,100 (+0.9%); humanities 49,600 (+2.5%); and arts 15,500 (-0.6%) - a general increase of 1.6% Destatis, 2024. That one-year uptick in humanities doesn't cancel out the structural decline of twenty years that I described above - it's exactly the kind of noise from a single cycle that this investigation aimed not to confuse with a trend.
It's worth noting that the "demographic cliff" likely explains more of Europe's aggregate behavior than AI itself. The European Union's fertility rate hit a historic low of 1.34 in 2024; in the Netherlands, first-year enrollment dropped 3.3% for the 2025-26 cycle, and in the UK, total enrollment for 2024-25 fell 1%, with non-EU postgraduates decreasing 10% AcademicJobs.com. A specific study on the history of computer science in Germany confirms something I suspected from Destatis' own numbers: there was a real fluctuation pattern — sustained growth from 2008/09 to 2019/20, surpassing 35,000 new students, a drop to ~33,500 in 2021, a new record in 2022/23, and -2.3% in the most recent academic year — but that's exactly what it is, a multi-year fluctuation without a single direction, not a sustained decline attributable to generative AI Gesellschaft für Informatik (gi.de).
On a Union-wide scale, the 2024 landscape confirms the relative stability that Germany suggests: 21.9% of all tertiary education students were enrolled in "business, administration, or law" — the most numerous field — followed by engineering/manufacturing/construction and health/wellness, both with 14.7%, and arts and humanities with 11.1% Eurostat. What has been moving, in a sustained manner over a full decade, is the absolute volume of STEM graduates: from 18.5 per 1,000 people aged 20-29 in 2014 to 22.4 in 2023 Eurostat. And on the employment side, with training in information technologies — the closest data to "how well European computer science graduates are being absorbed" — the EU workforce with ICT education grew from 2.5 million people in 2016 to 3.3 million in 2025, with the proportion holding a tertiary degree increasing from 71.5% to 74.8% over the same period, an average annual growth of 5.2% over a decade Eurostat.
A finding worth highlighting because it contradicts the intuition that "Europe is ahead of the US in all things digital": the EU actually graduates very few ICT specialists relative to its young population — 2.6 per 1,000 young people, compared to 4.6 in the UK, 3.9 in Canada, and 3.7 in the US — despite 26.9% of all EU tertiary students being in some STEM field in 2023 Education and Training Monitor. Within the bloc itself, Germany leads in tertiary STEM enrollment with 35.5%, followed by Finland (35.3%) and Greece (33.7%); Malta has the lowest figure, 13.9% Education and Training Monitor.

Germany: four fields, four distinct trajectories
Comparison of four German university disciplines between their starting point and the most recent data published by Destatis: Computer Science is growing steadily, Mathematics and Natural Sciences are declining gently, Humanities have accumulated a 22% decline in new enrollments over 20 years, and Law - after nearly half a century of growth - peaked in 2020 and has been declining slightly since.
Ver los datos
| Concepto | Valor (%) |
|---|---|
| Computer Science, total enrollment (2023/24 → 2025/26) | +5.3% |
| Mathematics and Natural Sciences, total enrollment (2023/24 → 2025/26) | -2.6% |
| Humanities, new enrollments (2003 → 2023) | -22% |
| Law, total enrollment (peak 2020 → 2025) | -2.1% |
Mexico: the oversupply of law degrees is older than ChatGPT
Total higher education enrollment in Mexico grew from 1,933,907 students in the 2010-2011 cycle to 3,493,562 in 2021-2022, a 44.64% increase over twelve years Scielo México. I've highlighted this entire block of Mexican sources in yellow because they come from a single academic aggregator analysis, without my directly cross-checking the raw tables from ANUIES — but the internal pattern is consistent and revealing in itself. Within this national growth, Engineering, Manufacturing, and Construction rose from 592,454 to 823,308 students (+28.03%), and Social Sciences and Law from 241,499 to 340,704 (+29.11%) — both below the national average growth rate Scielo México. The area that truly fell behind was Information and Communication Technologies — the one that, in theory, should be booming due to the AI wave — with only 5.12% growth over the same twelve years Scielo México. This is a contrast almost opposite to that of the US: there, computer science was growing non-stop until just two years ago; in Mexico, the tech area has been growing much slower than the rest of the system for over a decade.
When it comes to law, the Mexican rumor isn't that it's "disappearing" - it's actually the opposite. Law remains the most popular major in the country. In the 2024-2025 cycle, law had the most new enrollments, with 94,367 students (53,252 women, 41,115 men), making up about 8% of all new enrollments nationwide, according to ANUIES Publimetro sobre datos de ANUIES. But here's what really matters for our main argument: this oversupply isn't new, and it's not caused by generative AI. Back in the 2014-2015 cycle, Mexico already had 813 institutions and 1,535 law programs, with 278,170 enrolled students; between 2011 and 2015, private institutions almost doubled their number of law programs (from 753 to 1,401) and their enrollment grew from 95,565 to 143,146 students Scielo México. The oversupply of law schools in Mexico is a structural phenomenon that's at least 15 years old - it didn't start with ChatGPT.
On the AI front, ANUIES reports that Mexican universities offer 43 educational programs directly related to artificial intelligence (24 undergraduate, 19 graduate), with about 3,600 students enrolled nationwide; an ANUIES coordinator noted that this number will "increase significantly" by the end of 2026, with a regional focus on Querétaro, Guanajuato, San Luis Potosí, and Baja California, tied to the automotive and aerospace industries ANUIES. These numbers are still small compared to the size of the system, but they're the only hard evidence that Mexico is building formal academic programs around the "AI" label - not just talking about it.
China: the power that cancels the most majors, and the one that publishes the least detailed enrollment data
China is the country that most aggressively uses academic program offerings as a tool for industrial policy - and at the same time, it's the one that provides the least transparent data on actual enrollment by major. It's worth saying this with the same honesty as in a previous piece, where I noted the 42% unverified claim about CNCF: here, the finding itself is that the Chinese government happily publishes the number of programs it opens and closes nationwide, but it barely publishes series equivalent to those from Destatis or NCES, with exact enrollment numbers, year by year, by major and university. This conditions everything that follows.
However, the numbers on program openings and closures are solid and come from official sources. Between 2021 and 2025, Chinese universities revoked or suspended 12,200 undergraduate programs while introducing 10,200 new ones; the cuts focused on arts, humanities, foreign languages, and administration, while engineering accounted for 1,322 of the newly approved programs - 39% of the total South China Morning Post. The annual series of discontinued programs confirms that this has been accelerating for several years, not just a one-cycle event: 367 in 2019, 925 in 2022, 1,670 in 2023 (a historic record), and 1,428 in 2024 - more than 5,000 canceled between 2019 and 2024, with Management and Information Systems, Public Administration, Fashion Design, and Product Design among the most cut China News Service (Ecns.cn). A March 2023 directive from the Ministry of Education sets the explicit goal of optimizing around 20% of all undergraduate programs in the country by 2025 - this isn't a spontaneous market effect, it's a state policy with a published target number.
The new major catalogs confirm the direction: the batch of 24 approved majors in March 2024 includes high-power semiconductor science and engineering, rare earths, smart materials, national security studies, and sinology - as well as two unusual ones worth mentioning out of curiosity, coffee science and ice dancing RADII. The April 2026 catalog added 15 more interdisciplinary majors, including "embodied intelligence" (authorized in nine universities), brain-machine science and technology, and agricultural robotics, explicitly framed as a response to the changing needs of national strategies Gobierno de China. In the 2025 catalog, the Ministry added 29 new majors, "most of them oriented towards STEM"; top-tier universities simultaneously cut enrollment and eliminated programs like public administration, musicology, and broadcasting Sixth Tone.

Law has its own Chinese pattern, documented with university names but with a single source of origin that I marked in yellow: between 2014 and 2024, several universities — China University of Petroleum-Beijing, Taiyuan Institute of Technology, Tianjin Medical University, Dalian University of Technology, Northeastern University, among others — canceled their law majors as part of the Ministry of Education's optimization plan NetEase (163.com).
The boom in artificial intelligence as a formal career is cross-verified by two independent sources that arrive at the same number, giving this data more weight than almost any other in the China section: universities with AI majors went from 35 approved in 2018 to over 600 by 2026 (626 exact in 2025), with at least 90 "Double First-Class" universities opening schools or faculties dedicated to it Sina Finance China Daily. In the first batch of approvals in 2018, those 35 universities ran in parallel with 101 universities authorized for Robotics and 203 for Data Science and Big Data; by 2021, AI was already the discipline with the most new additions in the country, with 130 universities adding it in just one year CERNET. This is probably the fastest expansion of a single academic field in any country in this research — but, I insist on the underlying finding: I don't have, nor did I find in any public source, the equivalent series of real enrollment semester by semester that I have for Germany or the United States. China counts programs; it doesn't publish, or doesn't publish openly, how many students actually fill them.

China: which fields are gaining and losing university programs
National series (all areas combined) of canceled/suspended bachelor's programs versus new batches of majors approved by the Chinese MOE, 2019-2025. Verified sources don't publish the exact breakdown by year and broad field of study, so this graph shows the confirmed national totals instead of forcing area-specific numbers that aren't publicly available. Qualitative context not graphed: the 2021-2025 cuts focus on arts, humanities, foreign languages, and administration, while the 2019-2024 cuts focus on fashion design and product design; the only available numerical breakdown by area is engineering, with 1,322 of the newly approved programs in the 2021-2025 accumulation (the source describes this as "39% of the new total", a figure that doesn't match 1,322/10,200 ≈ 13%; possibly referring to a different base not clarified by the source).
Ver los datos
| 2019 | 2020 | 2021 | 2022 | 2023 | 2024 | 2025 | |
|---|---|---|---|---|---|---|---|
| Canceled/suspended (national total) | 367 | 0 | 0 | 925 | 1670 | 1428 | 0 |
| Newly approved (documented batches) | 0 | 0 | 0 | 0 | 0 | 24 | 29 |
India: the noisiest thermometer, but also one of the most solid in numbers
India is, of the five countries in-depth in this research, the one that offers the clearest and most sustained signal of reassignment towards computing — just the opposite of what's happening in the United States. The enrollment in B.Tech engineering reached 12.53 lakh (1.253 million) students in 2024-25, the highest level in eight years and +67% compared to 2017-18, driven mainly by AI/ML, data science, and computer engineering; the national vacancy rate fell to 16.36% Education Post India, sobre datos de AICTE. The series of occupancy of seats over five consecutive years is, of all the data I gathered in this research, the most cleanly "sustained" of all: the filling rate rose from 53.73% in 2020-21 to 75.07% in 2024-25, an increase of 21.34 percentage points in five years, driven by computing, AI/ML, data science, and IoT Careers360, sobre datos de AICTE. And by specific branch, computing and related disciplines already occupy more seats than any other: 390,245 B.Tech places filled in 2024-25, compared to 236,909 in mechanical and 172,936 in civil, out of a total of 14.90 lakh approved seats (12.53 lakh filled) Careers360. The national AISHE 2023-24 survey confirms the same pattern from another angle: Computer Engineering is already the most popular engineering branch in India, with 18.4 lakh students enrolled (39.7% of all engineering enrollment); total STEM enrollment crossed the crore (10 million) for the first time, and female participation in STEM rose from 38.4% in 2014-15 to 44% in 2023-24, out of a record total enrollment of 4.50 crore AISHE 2023-24.
On the other hand, mechanical and civil engineering have been consistently declining since 2022-23; up to 50% of civil engineering seats were left vacant in Bengaluru for two or three consecutive years, and states like Telangana, Karnataka, and Tamil Nadu are actively resisting converting those vacant seats to computing Careers360. The national regulator (AICTE) closed 58 colleges and discontinued over 950 courses for the 2025-26 cycle, in continuation with 800 institutions derecognized in 2018-19 and 179 closures in 2020-21 — a cumulative decline of over 27% in traditional engineering undergraduate enrollment since 2012-13 Times Higher Education. A case with a name and exact date: the Delhi Skill Development University closed five complete BTech branches (civil, mechanical, electrical, network engineering, mechatronics) on three campuses, by order of September 2, 2024, citing low enrollment Careers360.
India's top institutions - the IITs - are documenting this shift with specific examples: IIT Madras launched its Bachelor's in Artificial Intelligence and Data Analytics with the first cohort of 50 students admitted through the JEE exam for the 2024-25 cycle IIT Madras, comunicado oficial; IIT Bombay launched an 18-month executive postgraduate diploma in AI and Data Science, industry-oriented, starting January 2025 IIT Bombay, comunicado oficial; and by 2025, eleven of the country's twenty-three IITs already offered a formal AI program - Kharagpur and Madras joined in 2024, Mandi in 2025, after Roorkee opened its School of Data Science and AI in 2022 Shiksha.

There are two counterbalances that break any simplistic reading of "everyone in India is flocking to computer science and abandoning everything else". CLAT exam registrations - the national law admission test - had a few years of ups and downs (75,183 in 2020, dropping to a low of 54,253 in 2023) but ended at an all-time high of 92,344 in 2026, 17% above 2025, with new national law universities still being added for the 2026-27 cycle PW Live. And interest in design is also growing steadily: UCEED applicants increased by over 13% and CEED by over 23% in two years, with over 15,400 applicants in 2025 for just 245 spots in seven institutions Shiksha. In India, neither Law nor Design is in decline - the opposite of the pattern dominating the conversation in the US and the anticipated panic in Western graphic design.
Indian transparency is generally good but uneven: AICTE data on engineering seats is solid and consistent year after year, almost on par with Germany. But the official AISHE survey itself contains an inconsistency worth noting as a data quality finding, not hiding it: one synthesis reports that Arts/Humanities participation dropped from 30.2% (2020-21) to 29.4% (2021-22), while another synthesis from the same survey reports 34.2% (2021-22) dropping to 32.1% (2023-24) Online Manipal, síntesis de AISHE. Both agree on the direction (dropping, gradually) and that it remains the largest disciplinary group of all, but they don't agree on the exact magnitude - a discrepancy that would be unacceptable in Germany or the US, and is simply the state of the art of available data here.
Brazil, Colombia, and the rest of Latin America: aggregate growth, almost no career-specific breakdown
The pattern I found in Brazil and Colombia is almost a mirror of what I found in China, though for completely different reasons: solid aggregate growth, with high-quality official data, but almost no multi-year breakdown by specific career comparable to what Germany or the US offers. Brazil's 2024 Higher Education Census (INEP) shows that between 2023 and 2024, undergraduate enrollment grew 2.3%, while teaching licenses dropped 2.8% and technologists dropped 1.9%; distance education already accounts for 50.7% of all undergraduate enrollment, with a 5.6% increase in the same year INEP, Censo da Educação Superior 2024. Among the country's twenty largest undergraduate programs, Direito has 57.9% female participation and Ciência da Computação has 85.0% male participation - the gender composition data is solid, but the census doesn't offer, in the excerpts I reviewed, a multi-year enrollment series by career comparable to the German one.
Colombia, according to the Ministry of National Education's (SNIES) official 2024 enrollment statistics, showed a national growth of 3.14% in total enrollment, exceeding 2.553 million students; public institutions grew by over 67,000 enrolled (+5%) and private ones by over 10,000 (+0.88%); technical professional enrollment grew 5.01% and technological enrollment 5.14% SNIES, Ministerio de Educación de Colombia. I didn't find, in the public sources I consulted, specific figures broken down by Law vs. Software Engineering for Colombia in 2024 - I explicitly note this as a limitation of the available source, not an actual absence of change.
The overall picture for the entire region comes from UNESCO-IESALC: the gross enrollment rate in higher education in Latin America and the Caribbean rose from 40% in 2013 to 53% in 2023, and female participation in total enrollment increased from 19% to 41% over the last two decades. Despite this increase in access, the regional graduation rate has stalled at 24%, significantly lower than in high-income regions, with especially high dropout rates in Mexico (42%), Costa Rica (62%), and Chile (54%) UNESCO-IESALC, vía Infobae. This report also doesn't break down enrollment by field of study in the excerpts I was able to consult. The regional finding, therefore, is as important as any specific statistic: outside of Mexico (thanks to Scielo's academic analysis, which I cited earlier) and Brazil (thanks to the INEP census), Latin America simply doesn't publish - or doesn't publish in an accessible way - the series of "which careers are growing, which are shrinking" that does exist for Germany, the United States, and even India. This is a regional data gap, not an absence of real change.
The overall picture: OECD, G7, G20, and the BRICS gap
I explicitly requested OECD data for this piece, and it's worth presenting because it contradicts the alarmist tone of almost everything I've written so far. The OECD's Education at a Glance 2023 report is clear: "the distribution of new entrants... has remained largely unchanged" - in 2021, STEM accounted for 27% of new entrants, business/law 24%, health 14%, arts/humanities 10%, and social sciences/journalism 10% OCDE, Education at a Glance 2023. On the graduate side, the same report confirms: "the distribution of graduates by field of study has not changed substantially since 2015", with only a +3 percentage point increase in STEM in short-cycle programs; women accounted for 23% of ICT graduates in 2021, and Canada and Turkey are the only countries in the bloc with a decline in female participation in ICT since 2015 OCDE, Education at a Glance 2023.
The most recent report, Education at a Glance 2025, with two more years of post-massive generative AI data, continues to show relative stability by level: at the bachelor's level, STEM accounts for 23%, business/law 23%, arts/humanities 22%, and health 16%; at the master's level, business accounts for "almost three out of ten" students (~29%) and STEM 22%; at the doctoral level, STEM rises to "more than two-fifths... almost double that at the bachelor's level", with business falling to just 8% OCDE, Education at a Glance 2025. This is the most authoritative confirmation possible of something I've been suspecting chapter after chapter in this investigation: at the level of the rich country bloc as a whole, there is no massive shift in the distribution of careers. What there are, instead, are strong movements within specific subcategories - generic computing declining in the United States, formal AI growing everywhere, humanities declining since before AI - that cancel each other out when aggregated at the level of entire country blocks.
The most useful historical contrast comes from the United States versus the rest of the G20: an NCES analysis with 2015 data found that the United States awarded 41% of its first university degrees in social sciences, business, and law, compared to just 16% in science, mathematics, and engineering - the lowest proportion in the entire G20. Japan, Saudi Arabia, and the United States were, at the time, the only three G20 countries where science/mathematics/engineering did not exceed arts/humanities NCES. This is pre-2020 data, but it explains why the recent decline in CS in the United States has such a strong narrative impact: it's part of a relative base that was already more oriented towards business/humanities than most of its G20 peers.

Here, I have to be as honest as I was about the opacity of Chinese data: I couldn't find a reliable public source with a comparable series of "academic offerings by field of study" specifically for the BRICS block as a unit, or for the G7 as a unit. The closest thing that exists is what I've already covered country by country — the US and Germany representing the G7, China and India representing BRICS, and Brazil providing the third available BRICS data — without an official aggregator equivalent to the OECD for those two political blocks. This is a finding of this investigation in itself: BRICS and G7 are useful geopolitical and economic labels, but no statistical office publishes a single figure for "how much BRICS' academic offerings are changing."

Global distribution of majors, almost unchanged
Despite the AI panic, the global mix of undergraduate enrollment has barely moved: STEM, business-law, arts-humanities, and health maintain almost the same relative weight as in previous years, according to the OCDE.
- STEM (science, technology, engineering, mathematics) — 23%
- Business and law — 23%
- Arts and humanities — 22%
- Health and wellness — 16%
- Other fields — 16%
Ver los datos
| Segmento | Valor |
|---|---|
| STEM (science, technology, engineering, mathematics) | 23 |
| Business and law | 23 |
| Arts and humanities | 22 |
| Health and wellness | 16 |
| Other fields | 16 |
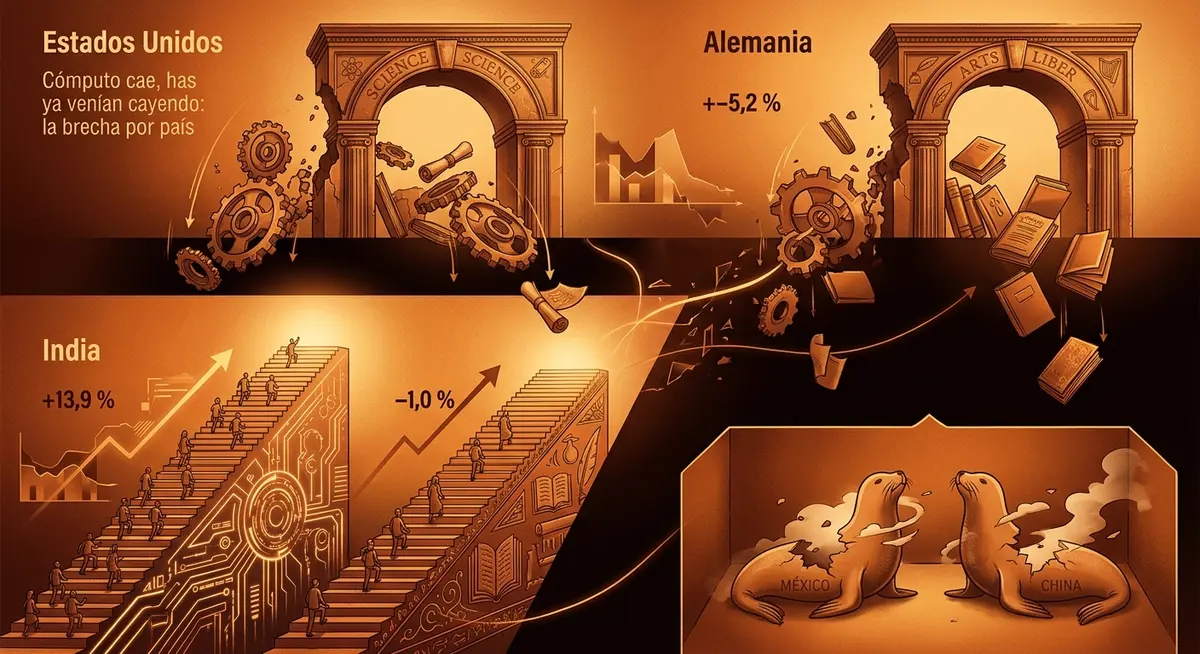
Computer science is down, humanities were already declining: the country gap
Direct comparison, country by country, of the most recent percentage change in computer science enrollment/admissions versus humanities/languages: in the US and Germany, both are declining together, while India is growing in computer science without a corresponding decline in humanities. Mexico and China were excluded due to the lack of verified figures on percentage change in humanities/languages enrollment in the research.
United States
-8.1%→-13%
Germany
-2.3%→-22%
India
+67%→-6.1%
Ver los datos
| Concepto | Computer science | Humanities/languages |
|---|---|---|
| United States | -8.1% | -13% |
| Germany | -2.3% | -22% |
| India | +67% | -6.1% |
The radar: who's really changing, and who just seems to be
With all the above gathered, I built a radar chart (Radar Chart, below) that compares the US, Germany/European Union, Mexico, China, and India on the axis that really matters for this investigation: how fast their university academic offerings are changing, not how much AI their students use or how much the topic is discussed on social media. I chose five axes: overall speed of change in offerings (how far the system is today from where it was in 2015-2020), rate of opening formal AI programs, rate of closing or discontinuing existing programs, degree of direct state intervention in the curriculum (versus decentralized decisions by each university), and transparency of available data to measure all this from the outside.
China dominates the first three axes by a wide margin — over 12,000 programs moved in five years, hundreds of new universities offering AI, and a state directive with a published numerical goal — but sinks in the transparency axis, precisely because that volume of change is measured in program count, not verifiable real enrollment series. India ends up in an unusual intermediate point: genuinely fast and sustained change (engineering enrollment increasing 21 percentage points in five years is as dramatic as any Chinese figure), real state intervention through AICTE, but with better data transparency than China. The US has almost no state intervention in the curriculum — decisions are made by each university — but a decentralized market change that resulted, paradoxically, almost as fast as the Chinese one in the specific case of computing, with the best data transparency of the five. Germany and the European Union are, with these five axes, the most stable block of all: slow change, almost no direct state intervention in existing careers, and the highest data transparency on the planet. Mexico is at the opposite end of China: slow change (its own law school overcapacity has been unresolved for fifteen years), minimal state intervention, and limited data transparency to a single academic aggregator study, without an equivalent of a Destatis or an NCES of its own.
The crystal ball: what a five-year-old today will probably not be able to study
This is the speculative part of the piece, and I'm marking it as such without ambiguity: what follows is a reasoned projection based on everything above, not a verified fact like the data above. But after going through nine different university systems, there are patterns consistent enough to make some concrete bets on what will exist — and what will be increasingly hard to find — when a child who is five years old today reaches the age to choose a career, in thirteen or fourteen years.
I'm starting with what will likely shrink to practical irrelevance or only exist in a handful of elite universities, rather than being widespread like it is today. Monolingual degrees in "pure" foreign languages - I'm not talking about language as a tool within another major, but a full major dedicated solely to French, German, or Russian with no technical component - have already dropped 48% in the US over the past decade, with cases like West Virginia University eliminating the entire department. If high-quality machine translation becomes the norm over the next ten years, I don't see any force that would reverse this trend; it's likely that these programs will only survive as concentrations within international relations or computational linguistics, not as standalone majors outside of a small group of research universities. History, religious studies, classical studies, and comparative literature - all of which have seen drops of 40% to 59% - are at similar risk of only surviving in large universities with sufficient endowments to maintain small departments for prestige, not market demand.
The case of "generic computer science" is more nuanced, and I'd say that the label itself - not the discipline - is what's at risk of disappearing in its current form. What I'm seeing in the data isn't that programming will stop being taught; it's that the generic "Computer Science" label is fragmenting into more specific fields - AI, data science, cybersecurity, robotics - which are already growing while the generic label declines. A five-year-old kid probably won't find, thirteen years from now, a prestigious university offering a plain "Computer Science" major; instead, they'll find a half-dozen majors with much more specific names competing for the same student.

Traditional journalism - the kind that trains generalist reporters for print or linear radio/TV, without specialization in data or digital production - has already seen a drop of over 20% in at least one university program with a long track record, and the underlying trend (fewer advertisers, fewer newsrooms, more automated text generation) shows no signs of reversing. It's likely that journalism will survive almost exclusively as a concentration within communications or as specialized graduate programs in investigative or data journalism, not as the massive undergraduate major it was twenty years ago.
On the other hand, what will be widely available, without kids having to look very far: nursing and health professions in general, with three consecutive years of documented growth and an aging demographic in almost every country in this study; cybersecurity, which has already grown 271% over the past decade and has no visible ceiling as long as there are digital systems to protect; two-year technical trades - mechanics, repair, engineering technologies - which are growing sustainably precisely because they're the hardest to fully automate with software; and, of course, any variant with the explicit label "Artificial Intelligence", which has gone from 4 to 23 institutions in the US over five years, from 35 to over 600 in China over eight, and already has formal programs in eleven of India's twenty-three IITs. Civil and mechanical engineering is the most ambiguous case of all: it's declining in India due to historical over-supply and in the US due to student preference, but remains stable in Germany - which suggests that its fate depends more on each country's industrial policy (does the country build its own factories and infrastructure, or import them?) than on AI itself.
I want to close this section with the most uncomfortable bet of all: Law, contrary to popular intuition, probably won't disappear in any of the countries in this investigation — not even in China, where some specific universities have already canceled their programs. What's going to change is the relative volume of generalist lawyers at the entry level versus certified specialists using AI tools in law, and probably a greater concentration in a smaller number of high-prestige schools, with the segment of small and unaccredited schools — which has already been shrinking in California since 2012 — absorbing most of the adjustment. Law isn't dying. It's just becoming more concentrated.

The crystal ball: what will be scarce and what will be abundant
Direct comparison of two already documented enrollment trends: majors that are being reduced or closed (candidates to become scarce or restricted in 10-15 years) versus those that are in sustained expansion (candidates to become widespread).
| Likely scarce or restricted access (2035-2040) | Likely massive and widely available (2035-2040) |
|---|---|
| Foreign languages (translation/linguistics): enrollment in the US -16.6% (2016-2021), -29.3% since the 2009 peak | Nursing (BSN): +7.6% in 2024-25, third consecutive year of growth (AACN) |
| Traditional humanities (history, classical languages, area studies): -41% to -55% in the US since 2012 (AAAS) | Cybersecurity: degrees and certificates +271% in the US between 2012 and 2022 (NCSES/NSF) |
| Generic CS without specialization: -8.1% in the US (fall 2025), first national decline in almost 20 years (NSC) | 2-year technical trades: enrollment +20% since 2020; certificates +28.3% since 2021 (NSC Research Center) |
| Traditional general journalism: -20.8% at U. Nebraska-Lincoln (2013-2022); 60% of AI experts predict fewer jobs (Pew, 2025) | Formal bachelor's degrees in AI/data science: US from 4 to 23 institutions (2020-2025); China from 35 to 600+ universities (2018-2026) |
| Small unaccredited law schools: from 25 to 13 in California, 2012-2023, mostly due to voluntary closures | AI programs in Mexico: 43 current, a figure ANUIES expects to see 'substantially increased' by the end of 2026 |
| Generic graphic design: #11 among the fastest-declining professions globally to 2030 (WEF Future of Jobs 2025) | Health and wellness: 14.7% of EU tertiary enrollment in 2024, tied with engineering (Eurostat) |
Ver los datos
| Likely scarce or restricted access (2035-2040) | Likely massive and widely available (2035-2040) |
|---|---|
| Foreign languages (translation/linguistics): enrollment in the US -16.6% (2016-2021), -29.3% since the 2009 peak | Nursing (BSN): +7.6% in 2024-25, third consecutive year of growth (AACN) |
| Traditional humanities (history, classical languages, area studies): -41% to -55% in the US since 2012 (AAAS) | Cybersecurity: degrees and certificates +271% in the US between 2012 and 2022 (NCSES/NSF) |
| Generic CS without specialization: -8.1% in the US (fall 2025), first national decline in almost 20 years (NSC) | 2-year technical trades: enrollment +20% since 2020; certificates +28.3% since 2021 (NSC Research Center) |
| Traditional general journalism: -20.8% at U. Nebraska-Lincoln (2013-2022); 60% of AI experts predict fewer jobs (Pew, 2025) | Formal bachelor's degrees in AI/data science: US from 4 to 23 institutions (2020-2025); China from 35 to 600+ universities (2018-2026) |
| Small unaccredited law schools: from 25 to 13 in California, 2012-2023, mostly due to voluntary closures | AI programs in Mexico: 43 current, a figure ANUIES expects to see 'substantially increased' by the end of 2026 |
| Generic graphic design: #11 among the fastest-declining professions globally to 2030 (WEF Future of Jobs 2025) | Health and wellness: 14.7% of EU tertiary enrollment in 2024, tied with engineering (Eurostat) |
What would I do if I had to advise a student today?
I'm not going to give the generic advice to "learn to code" or the opposite, "study what you're passionate about without thinking about the market" — the data from this investigation points to something more specific. First: if the career you're interested in has a generic label from thirty years ago (Computer Science, general Business Administration, un-specialized Journalism), ask the specific program how recent their curriculum is and how specific it is. The fragmentation into more specific fields — AI, cybersecurity, data science, sustainable design — is, based on the data I gathered, more consistent across countries than any other trend.
Second: be skeptical of any headline that uses a single year of data as if it's destiny. The rebound of Law in the US in 2025 doesn't prove that Law is "back"; the decline of Computer Science doesn't prove that "programming is over." Always ask for a series of at least three or four years of data before taking a decline or increase as a real signal, and explicitly ask if someone has already tried to attribute a single cause to that movement — like the Stanford study I cited above, which refused to attribute the decline of CS solely to AI.
Third, and I'm saying this with evidence from Germany and India in hand: look at what the university system in your own country is doing, not just what dominates the conversation on social media in English. The narrative of "everyone is fleeing computer science" is real in the US and doesn't exist with the same force in Germany or India — where computer science continues to grow without visible brakes. And fourth: if your child has a genuine talent for something that seems "at risk" today — design, languages, arts — the hard evidence I gathered says that the discipline itself rarely disappears completely; what changes is how many institutions offer it and how competitive it becomes to get into the ones that survive. That's not empty comfort: it's literally what happened with Law in Mexico since 2014, with visual arts in the US, and with the ice industry that I opened and closed this piece with.
Ice, again
I'm coming back, to close, to Frederic Tudor. By 1914, the production of "plant ice" — mechanically manufactured — had reached 26 million tons in the US, already surpassing the 24 million tons of natural ice harvested that same year: the exact point where mechanical technology definitively displaces manual harvesting Wikipedia, Ice trade. Just thirty-four years earlier, in 1880, fifty million Americans used more than five million tons of ice per year — 200 pounds per person — and the country was the world's largest ice exporter American Enterprise Institute. An official report from 1879 estimated the national annual harvest at between 8 and 10 million tons, with New York City alone consuming nearly one million tons per year National Geographic. None of that saved the trade when mechanical refrigeration arrived.
What's really admirable, and probably the most useful lesson from this parallel, is that the dominant company in the industry survived the technological shift by fully adapting, rather than denying it: the Knickerbocker Ice Company harvested its last natural ice from Rockland Lake in 1924, and by 1928, it had completely converted to producing artificial ice with tap water in ten plants in Brooklyn South Street Seaport Museum. Tudor's own business in India — an ice house in Calcuta since 1833 that generated around $220,000 in profit over twenty years — collapsed in the 1880s due to the same technology, and its warehouse in Madras ended up being converted into the building now known as Vivekanandar Illam Wikipedia. Even the innovation that made Tudor's business viable for decades — reducing ice loss due to melting from "66% to 8%" through better insulation — was, at its core, just a temporary fix: it made the business profitable for thirty more years, not indefinitely South Street Seaport Museum.

The ice empire of Frederic Tudor, from 1806 to its collapse
From the experimental shipment of 130 tons of ice to Martinique in 1806 to the complete pivot of Knickerbocker Ice Company to manufactured ice in 1928, via the peak of a 90,000-employee industry and the 1914 technological crossover where plant-made ice surpassed naturally harvested ice.
- 180622-year-old Frederic Tudor loads the brig "Favorite" with 130 tons of ice from Massachusetts and ships it to Martinique. The Boston Gazette reacts with incredulity ("No joke... A vessel has cleared at the Custom House for Martinique with a cargo of ice"); the trip loses $4,500 and subsequent shipments to Havana also lose money.
- 1805–1836Tudor redesigns ice houses (double wall, insulation) and reduces melting loss in storage and transport from 66% to 8% — the operational innovation that makes the business viable long before mechanical refrigeration makes it obsolete.
- 1833Tudor's business expands to Calcutta, India. In 20 years, it generates approximately $220,000 in profit (around $8.5 million in 2025 dollars).
- 1855Three competitors merge to form the Knickerbocker Ice Company, which will eventually come to dominate the industry.
- 1879Official report: the annual national harvest of natural ice in the US is around 8 to 10 million tons. New York City alone consumes about 1 million tons per year, Chicago 580,000 tons, and Boston and Philadelphia nearly 400,000 tons each.
- 1880Peak of the harvested ice industry: 50 million Americans use over 5 million tons of ice per year (200 pounds per capita), and the US is the world's largest ice exporter.
- Late 19th centuryAt its peak, the international ice trade employs 90,000 people and 25,000 horses, in an industry capitalized at $28 million (~$660 million in 2010 dollars). On the Hudson River alone, nearly 20,000 people work in 135 ice storage facilities.
- 1880sTudor's ice business in India collapses with the arrival of commercial refrigeration technology. The Madras ice house is repurposed and eventually becomes the building now known as Vivekanandar Illam.
- 1914Historic milestone: "plant ice" (mechanically manufactured) production reaches 26 million tons in the US, surpassing the 24 million tons of harvested natural ice.
- 1924The Knickerbocker Ice Company harvests its last natural ice from Rockland Lake, ending commercial harvesting after nearly seven decades of operation.
- 1928Knickerbocker completely converts: it manufactures artificial ice with tap water in 10 plants in Brooklyn -- a total pivot, documented from within the company that once dominated natural ice.
Ver los datos
| Año | Hecho |
|---|---|
| 1806 | 22-year-old Frederic Tudor loads the brig "Favorite" with 130 tons of ice from Massachusetts and ships it to Martinique. The Boston Gazette reacts with incredulity ("No joke... A vessel has cleared at the Custom House for Martinique with a cargo of ice"); the trip loses $4,500 and subsequent shipments to Havana also lose money. |
| 1805–1836 | Tudor redesigns ice houses (double wall, insulation) and reduces melting loss in storage and transport from 66% to 8% — the operational innovation that makes the business viable long before mechanical refrigeration makes it obsolete. |
| 1833 | Tudor's business expands to Calcutta, India. In 20 years, it generates approximately $220,000 in profit (around $8.5 million in 2025 dollars). |
| 1855 | Three competitors merge to form the Knickerbocker Ice Company, which will eventually come to dominate the industry. |
| 1879 | Official report: the annual national harvest of natural ice in the US is around 8 to 10 million tons. New York City alone consumes about 1 million tons per year, Chicago 580,000 tons, and Boston and Philadelphia nearly 400,000 tons each. |
| 1880 | Peak of the harvested ice industry: 50 million Americans use over 5 million tons of ice per year (200 pounds per capita), and the US is the world's largest ice exporter. |
| Late 19th century | At its peak, the international ice trade employs 90,000 people and 25,000 horses, in an industry capitalized at $28 million (~$660 million in 2010 dollars). On the Hudson River alone, nearly 20,000 people work in 135 ice storage facilities. |
| 1880s | Tudor's ice business in India collapses with the arrival of commercial refrigeration technology. The Madras ice house is repurposed and eventually becomes the building now known as Vivekanandar Illam. |
| 1914 | Historic milestone: "plant ice" (mechanically manufactured) production reaches 26 million tons in the US, surpassing the 24 million tons of harvested natural ice. |
| 1924 | The Knickerbocker Ice Company harvests its last natural ice from Rockland Lake, ending commercial harvesting after nearly seven decades of operation. |
| 1928 | Knickerbocker completely converts: it manufactures artificial ice with tap water in 10 plants in Brooklyn -- a total pivot, documented from within the company that once dominated natural ice. |
University academic offerings don't change overnight like a commodities market — there's inertia, departments have their own funding, and governments subsidize specific fields for reasons unrelated to actual student demand. That's why nothing I've documented here looks like a three-year collapse like natural ice did in the face of mechanical refrigeration. But the underlying pattern — a new technology making something that was taken for granted for generations obsolete, not all at once, but program by program, country by country — is exactly the same. The question I'm left with, and I'll leave it to the reader, is: if you had to bet on a career for a five-year-old child today, would you advise them to pursue the most specific label possible within what they're passionate about, or would you still trust that "study what you like" is enough advice in a world where the very definition of careers is changing faster than at any other point measured in this investigation?
Esteban Rey
X: @Kilowatto
LinkedIn: https://www.linkedin.com/in/kilowatto
Wikidata: https://www.wikidata.org/wiki/Q140672978
Who changes their academic offerings the fastest?
Comparative analysis of the US, Germany/EU, Mexico, China, and India across five axes: how quickly they move their academic offerings from 2015-2020, how many formal AI programs they open, how many existing programs they close/discontinue, how much direct state intervention there is in the curriculum, and how transparent the available data is for measuring it from the outside. Scale 0-10 per axis, estimated by Kilowatto based on cited evidence (not official indices).
- United States
- Germany / EU
- Mexico
- China
- India
Ver los datos
| Eje | United States | Germany / EU | Mexico | China | India |
|---|---|---|---|---|---|
| Overall speed of change (2015-2020→today) | 6 | 4 | 3 | 10 | 7 |
| Opening of AI programs | 7 | 4 | 3 | 10 | 7 |
| Closure of existing programs | 6 | 3 | 1 | 9 | 7 |
| State intervention in the curriculum | 2 | 2 | 3 | 10 | 7 |
| Transparency of data | 9 | 9 | 5 | 5 | 6 |
Metodología de esta investigación
For this piece, I gathered 97 verified findings before sitting down to write, and I ended up using 88 in the body of the text. I explicitly discarded those that relied almost entirely on employment projections or labor market perception instead of actual academic offerings — junior associate hiring, graduate employment gaps, AI and work sentiment surveys, youth unemployment — because the assignment for this piece was to measure programs and enrollment, not employment. I allowed myself a single line of labor context throughout the text, in the graphic design section, because it connected naturally with an academic offering data point and not the other way around. None of the data points that appear in the body were left in the "unverified" red category; those that had only a single source without cross-corroboration, I explicitly marked in yellow, never disguising them as verified data.
The availability and quality of data vary greatly from country to country. I'd like to be clear about this, just as I was when I mentioned the 42% unverified claim about CNCF in another piece in this series. Germany and the US have, by far, the best transparency: official series, annual, by exact career, and traceable over several decades (Destatis, NCES, National Student Clearinghouse). The European Union as a whole (Eurostat) and the OECD (Education at a Glance) publish comparable series between countries using the same methodology. India has solid data on engineering and quotas (AICTE), but notable inconsistencies in other areas — I documented one instance where two summaries of the same official AISHE survey didn't match in terms of the exact magnitude of a change. China readily publishes the number of programs it opens and closes at the national level, but almost never the actual enrollment behind those numbers: this is, in itself, one of the central findings of this piece, not a gap I filled with assumptions.
I didn't find official aggregated series for BRICS or the G7 as blocks — I also mention this in the body of the text — so that context is built here country by country, using the US and Germany as representatives of the G7, and China, India, and Brazil as representatives of BRICS, instead of using a single aggregator like the one that exists for the OECD. The final section, "the crystal ball," is explicitly speculative: it's my reasoned interpretation of the patterns documented above, not a verified finding, and I mark it as such without ambiguity within the text itself.
Fuentes
- Wikipedia, Frederic Tudor
- Wikipedia, Ice trade
- National Student Clearinghouse
- CRA Taulbee Survey
- National Student Clearinghouse
- Fortune, agosto 2026
- Fortune sobre Goldman Sachs, junio 2026
- TechUnpacked
- Futurism
- TechUnpacked / College Board
- Futurism sobre el estudio de Jacob Light
- CRA / Center for Evaluating the Research Pipeline
- ABA Journal / TaxProf Blog
- ABA Journal
- ABA Task Force on Law and AI
- ABA AI Task Force, Year 2 Report
- Data USA
- World Economic Forum, vía Design Week
- Design Week
- Delaware Public Media
- Kunstfonds
- AAAS Humanities Indicators
- AAAS Humanities Indicators
- Inside Higher Ed sobre el censo MLA
- Modern Language Association, censo otoño 2021
- Inside Higher Ed
- UNL, tendencias del programa
- NCES, tabla 325.95
- AAUP, Program Closures tracker
- American Association of Colleges of Nursing
- National Student Clearinghouse Research Center
- NCSES/NSF
- APSA, Political Science Now
- NASAD, encuesta HEADS
- Statistisches Bundesamt (Destatis)
- Destatis
- Destatis
- Destatis
- Destatis, serie 1975-2025
- Destatis, 2024
- AcademicJobs.com
- Gesellschaft für Informatik (gi.de)
- Eurostat
- Eurostat
- Eurostat
- Education and Training Monitor
- Education and Training Monitor
- Scielo México
- Scielo México
- Scielo México
- Publimetro sobre datos de ANUIES
- Scielo México
- ANUIES
- South China Morning Post
- China News Service (Ecns.cn)
- RADII
- Gobierno de China
- Sixth Tone
- NetEase (163.com)
- Sina Finance
- China Daily
- CERNET
- Education Post India, sobre datos de AICTE
- Careers360, sobre datos de AICTE
- Careers360
- AISHE 2023-24
- Careers360
- Times Higher Education
- Careers360
- IIT Madras, comunicado oficial
- IIT Bombay, comunicado oficial
- Shiksha
- PW Live
- Shiksha
- Online Manipal, síntesis de AISHE
- INEP, Censo da Educação Superior 2024
- SNIES, Ministerio de Educación de Colombia
- UNESCO-IESALC, vía Infobae
- OCDE, Education at a Glance 2023
- OCDE, Education at a Glance 2023
- OCDE, Education at a Glance 2025
- NCES
- Wikipedia, Ice trade
- American Enterprise Institute
- National Geographic
- South Street Seaport Museum
- Wikipedia
- South Street Seaport Museum
Frequently asked questions
What happened to computer science enrollment in the United States?
Undergraduate computer science enrollment dropped for the first time in twenty years, with a -3.1% decrease in bachelor's degrees, -24.9% in master's degrees, and -2.2% in doctoral degrees in 2025, and continued to decline in 2026.
Is it true that universities are shutting down law programs?
Partially, total JD enrollment at American Bar Association-accredited law schools only dropped 1.2% in fall 2025, and enrollment rebounded in 2025.
What's the impact of AI on the graphic design industry?
The graphic design field is experiencing a labor alarm without a corresponding drop in enrollment.
Which countries were analyzed in the research on AI and higher education?
The research analyzed the United States, Mexico, China, India, Germany, and the European Union, with added context from the OCDE, G7, G20, and BRICS, and what's known about Latin America.
What happened to the natural ice industry in the 19th century?
The natural ice industry ceased to exist due to mechanical refrigeration technology, which made the entire trade of cutting, insulating, and transporting natural ice unnecessary.
How many US institutions offer a bachelor's degree in artificial intelligence?
The number of US institutions with a formal bachelor's degree dedicated to artificial intelligence went from 4 in 2020 to 23 in 2025.
What about the enrollment of high school students who took the AP Computer Science A exam?
The enrollment of high school students who took the AP Computer Science A exam dropped around 17% for 2026, although this has not been corroborated with a second independent source.
 Larry
Larry
Comentarios
Sé el primero en comentar.